
TL;DR:
- Tracking weekly active users, credits, and cost per prompt reveals adoption and efficiency issues early. Building layered dashboards and automating alerts support targeted interventions to optimize AI workflows and control costs. Monitoring messages per user over time predicts long-term habit formation and sustained value.
Track five metrics from day one: weekly active users (WAU), total credits/tokens consumed, cost per prompt, requests per user, and requests per project. Your immediate first step is to export your API logs and build a simple weekly KPI overview covering WAU, total credits, and your top 10 users or projects. That single export gives you a working baseline before you touch any dashboard tooling.
- WAU — how many unique users sent at least one message in the past seven days
- Total credits/tokens consumed — your primary cost signal
- Cost per prompt — credits divided by total requests; flags inefficient usage fast
- Requests per user/project — surfaces concentration risk and power users
- Trend change rate — week-over-week delta on any of the above
Pro Tip: Join your Cost API (or unified billing export) with prompt metadata — model, tokens in/out, task type — to separate high-value usage from high-volume waste.
Table of Contents
- What does ChatGPT usage analytics actually measure?
- How should you design a usage dashboard?
- How do you read adoption signals and act on them?
- What privacy and compliance steps matter for US teams?
- How do you implement ChatGPT usage analytics?
- What does a 30-day rollout look like?
- How do you connect usage data to business outcomes?
- How do you optimize prompts using analytics data?
- Which analytics tools work across ChatGPT and multi-AI environments?
- What do effective analytics implementations look like?
- How do you automate reporting and alerting?
- Key Takeaways
- The metric most teams ignore
- Promptchief turns your analytics findings into reusable workflows
- FAQ
What does ChatGPT usage analytics actually measure?
Workspace analytics is best read as an adoption lifecycle tool: access → activation → repeat use. Each metric tells you where users are stuck or thriving in that funnel.
| Metric | Definition | Signal |
|---|---|---|
| WAU | Unique users active in a week | Core adoption health |
| MAU | Unique users active in a 30-day window | Retention breadth |
| Seats purchased vs. activated | Provisioned seats with at least one session | Onboarding gap |
| Messages per WAU | Total messages ÷ WAU | Habit depth |
| Total credits/tokens consumed | Sum of tokens in + out across all requests | Cost exposure |
| Cost per prompt | Total spend ÷ total requests | Efficiency signal |
| Requests per user | Total requests ÷ active users | Power-user concentration |
| Requests per project | Requests grouped by project/GPT | Workflow adoption |
| Model/endpoint share | Share of requests per model version | Cost and capability mix |
| Error/retry rate | Share of failed or retried requests | Prompt quality or API issues |
| Time-to-first-response | Response latency | Infrastructure health |
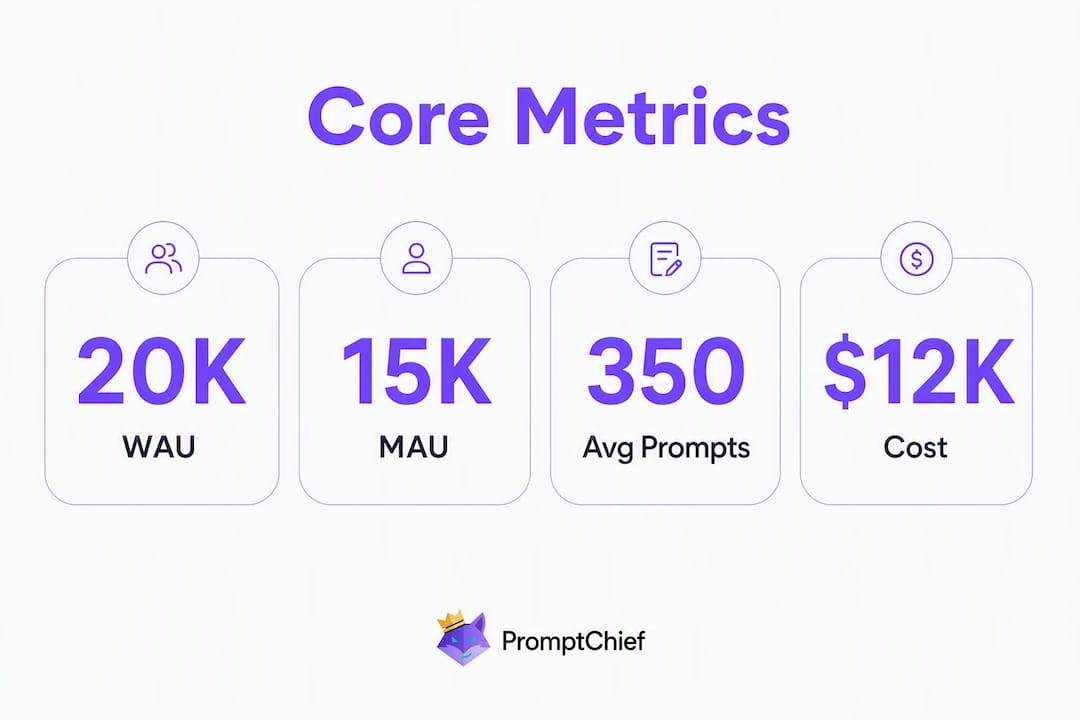
| Adoption metrics are WAU trend, activation rate, and messages per WAU. Cost-risk metrics are credits consumed, cost per prompt, and top consumers. Watch for rising enabled seats with flat activation — that gap almost always points to an onboarding problem, not a product problem. Concentrated usage in one or two projects signals a workflow that works and deserves scaling. Sudden model-switch spikes drive credit costs up fast; consistent one-off experiments with no repeat usage suggest stalled adoption downstream. |
How should you design a usage dashboard?
Practical enterprise usage dashboards follow three layers. Build them in this order.
Layer 1 — Overview KPIs: WAU sparkline, total credits consumed, top-line cost, and activation rate. These are the numbers your stakeholders check weekly. Keep them above the fold.

Layer 2 — Trend charts: Daily, weekly, and monthly consumption and cost over a rolling 90-day window. A stacked area chart for model mix shows immediately when a team switches from a cheaper model to a more expensive one.
Layer 3 — Granular breakdowns: Bar tables for top users, top projects, and top prompts by credit consumption. This is where you find the 20% of users driving 80% of spend.
| Dimension | Recommended filter | Why |
|---|---|---|
| Time window | Weekly, monthly, and quarterly windows | Trend vs. anomaly detection |
| Cohort | Team, department, role | Targeted interventions |
| Model version | GPT-4o, o3, etc. | Cost and capability tradeoffs |
| Project/GPT | Named project or custom GPT | Workflow-level attribution |
Design guidance: add overage warning indicators at 80% and 95% of credit limits, export to CSV via the Cost API, and embed read-only dashboard views for stakeholders who need visibility without admin access.
Pro Tip: Segment by cohort before you act. A department-level view often reveals that one team drives most of the cost, which makes targeted intervention far more precise than a workspace-wide limit.
How do you read adoption signals and act on them?
High enabled seats plus low activation almost always means a provisioning or onboarding problem. Check the Users tab, run a cohort comparison between activated and unactivated users, and look at onboarding logs for drop-off points.
- One-and-done experiments: A user sends 3–5 messages, never returns. Cause: no clear workflow fit. Fix: assign a role-specific prompt pack and follow up in week two.
- Concentrated usage around one GPT/project: One project consumes 60%+ of credits. Cause: a working workflow others haven't adopted. Fix: document it, share it, measure whether WAU rises.
- Credit spike after a model switch: Tokens per request jump when teams move to a more capable model without adjusting prompt length. Fix: audit prompt length and set a group credit limit.
- Steady WAU growth: The clearest signal of habit formation. Protect it — don't throttle active users to fix a cost problem caused by inactive ones.
Pick two cohorts (early adopters vs. late adopters, or one department vs. another), run a single targeted intervention (a prompt pack, a training session, a project template), and measure pre/post over two to four weeks.
Pro Tip: Correlate prompt length and model choice with credit burn using Cost API data. Long prompts on expensive models are often the culprit behind cost spikes, and shortening them with good prompt engineering cuts spend without reducing output quality.
What privacy and compliance steps matter for US teams?
Keep only what you need. For most analytics use cases, event-level metadata — model, tokens, user ID hash, timestamp, project ID — is sufficient. Full prompt text should be stored only when there is a documented business reason, and even then it should be pseudonymized.
- Never log PII inside prompt text — names, email addresses, SSNs, health data, or financial account numbers
- Pseudonymize user IDs before storing in any analytics pipeline; use a one-way hash tied to your IdP
- Set retention windows — 90 days for raw event logs, 12 months for aggregated KPI data is a common baseline
- Role-based access — analytics dashboards should be read-only for most users; write/export access limited to admins
- Secure export storage — S3 buckets with server-side encryption (SSE-S3 or SSE-KMS) and IAM policies scoped to analytics roles
- Regulated data types — HIPAA, FERPA, and CCPA each impose additional constraints; consult legal before storing any prompt metadata that touches those categories
This article is general information, not legal or compliance advice. Confirm your specific retention and data-handling obligations with qualified counsel.
How do you implement ChatGPT usage analytics?
Three patterns cover most teams.
- Native workspace analytics + manual exports — Use the OpenAI Admin Console Overview, Users, GPTs, and Projects tabs. Export CSVs weekly. Low setup cost; limited historical depth and no cross-platform view.
- Cost API → data warehouse → BI layer — Pull from the Cost API into BigQuery or Redshift, then visualize in Looker, Tableau, or a React dashboard. Full flexibility; requires engineering time.
- Lightweight event pipeline — Webhook or log-based capture for real-time alerting. Best for teams that need immediate overage notifications without a full warehouse build.
Implementation checklist:
- Enable workspace analytics in the Admin Console
- Configure Cost API credentials and test a pull
- Tag API requests with
user_id_hash,project_id, andmodelfields - Map SSO-provisioned users to analytics IDs
- Set group credit limits and overage alerts
- Schedule weekly CSV exports as a fallback
Key API metadata fields to record:
timestamp|user_id_hash|model|tokens_in|tokens_out|cost_estimate|prompt_id|project_id
Promptchief fits here as a prompt management layer. Its prompt manager captures prompt_id and usage context across ChatGPT, Claude, Gemini, and 24 other platforms, giving your analytics pipeline a stable identifier to join prompt metadata with Cost API spend data.
Pro Tip: Use the AI API Cost Calculator to model the cost impact of switching models before you make the change in production.
What does a 30-day rollout look like?
| Week | Owner | Deliverable | Cost ballpark |
|---|---|---|---|
| Week 1 | Admin | Inventory seats, export first CSV, confirm Cost API access | — |
| Week 2 | Admin + Analyst | Build baseline dashboard (Layer 1 + 2) | A typical BI tool may cost about $200 per month. |
| Week 3 | Admin + Team leads | Pick two cohorts, run one intervention | — |
| Week 4 | Admin | Measure pre/post, set credit alerts, document findings | — |
- Week 1: Pull the purchased → enabled → activated funnel; flag any gap larger than 30%.
- Week 2: Validate that credit data from the Cost API ties to prompt metadata before building charts.
- Week 3: Keep the intervention small — one prompt pack or one training session per cohort.
- Week 4: A two-to-four week measurement window is the minimum for a reliable pre/post read.
A manual-export setup costs nothing beyond staff time. A full data warehouse plus BI layer typically costs a few hundred dollars per month for a mid-size team, depending on query volume and tool licensing.
How do you connect usage data to business outcomes?
Usage metrics tell you what happened. Business outcomes tell you whether it mattered. The gap between them is where most analytics programs stall.
Start by picking one workflow your analytics already show as high-frequency — say, a project that generates 40% of all requests. Interview two or three of its users. What task does it replace? How long did that task take before? That conversation converts a token count into a time-savings estimate your CFO can read.
Then instrument the outcome side. If the workflow is content drafting, track time-to-publish. If it is code review, track PR cycle time. Pair those metrics with WAU and messages-per-WAU for the same cohort over 30 days. A rising WAU alongside a falling cycle time is the clearest signal that AI adoption is generating real value, not just activity.
How do you optimize prompts using analytics data?
Analytics surfaces which prompts are expensive, which are fast, and which get retried. Those three signals together point directly to optimization targets.
High retry rates on a specific prompt usually mean the output is inconsistent — the model needs more context or a tighter format instruction. High token counts with low task complexity mean the prompt is over-specified. Use prompt engineering principles to trim system context and move repeated instructions into a reusable template.
Sort your top-10 prompts by cost per request. The most expensive ones are candidates for model downgrade — test whether a less capable model produces acceptable output at lower cost. The AI model selector helps teams make that call without guessing. Prompts that score well on both cost and output quality are the ones worth packaging into shared prompt packs for wider team adoption.
Which analytics tools work across ChatGPT and multi-AI environments?
ChatGPT's web-visit share fell from 76.5% to 53.9% worldwide between early 2025 and May 2026, while Claude and Gemini each took significant share. That shift means single-platform analytics now misses a growing portion of your team's actual AI usage.
For multi-AI tracking, the practical options fall into three categories:
- Native admin consoles — OpenAI Admin Console, Google Workspace AI analytics, Anthropic Console. Each covers its own platform only; no cross-platform aggregation.
- Data warehouse + Cost API approach — Pull from each platform's billing or usage API into a shared warehouse. Requires engineering but gives you a unified view across models.
- Prompt management platforms — Tools like Promptchief that sit across 27+ AI platforms and capture prompt-level metadata regardless of which model processes the request. This gives you a cross-platform
prompt_idto join against any billing export.
The warehouse approach gives the most flexibility. The prompt management layer gives the most granularity at the prompt level. Most teams end up using both.
What do effective analytics implementations look like?
A content team running ChatGPT for drafting notices that WAU is high but messages-per-WAU is low — users start a session, get one draft, and leave. They pull the top-10 prompts by request volume and find that 70% of sessions use a single generic "write a blog post about X" prompt. They package three structured alternatives into a shared prompt pack, distribute it via Promptchief's team workspace, and measure over four weeks. Messages-per-WAU rises as users iterate on drafts rather than starting fresh each time.
A developer team sees a credit spike after migrating to a newer model. The Cost API data shows tokens-per-request doubled because system prompts were copied from the old model without trimming. They audit the top five prompts by token count, cut redundant context, and bring cost-per-request back to baseline within two weeks.
Both cases follow the same pattern: identify the signal in the data, trace it to a specific prompt or workflow, make one change, and measure.
How do you automate reporting and alerting?
Manual weekly exports work for small teams. At scale, automation is what keeps analytics from becoming a chore that gets skipped.
Set credit alerts at 80% and 95% of your group limit — OpenAI's Admin Console supports this natively. For cross-platform alerts, route Cost API data to a Slack webhook or PagerDuty integration so the right person gets notified before an overage hits.
For reporting, schedule a weekly SQL query against your data warehouse that outputs WAU, total credits, cost per prompt, and top-5 users/projects. Pipe the output to a Google Sheet or a read-only Looker dashboard and share the link with stakeholders. That single automated report replaces most ad hoc analytics requests. Add a monthly cohort comparison query to track whether your interventions from week three are holding.
Key Takeaways
Effective ChatGPT usage analytics requires tracking WAU, credits consumed, and cost per prompt from day one, then acting on adoption signals with targeted cohort interventions measured over two to four weeks.
| Point | Details |
|---|---|
| Start with five core metrics | WAU, total credits, cost per prompt, requests per user, and requests per project cover adoption and cost risk. |
| Use the three-layer dashboard | Overview KPIs, trend charts, and granular breakdowns let you triage fast without drowning in data. |
| Treat analytics as lifecycle tracking | Access → activation → repeat use is the funnel; rising WAU with rising messages-per-WAU confirms habit formation. |
| Automate alerts at 80% and 95% | Native credit alerts in the Admin Console help prevent overages. |
| Promptchief captures prompt-level metadata | Its cross-platform prompt manager adds a stable prompt_id to join against Cost API spend data across many AI tools. |
The metric most teams ignore
Most analytics programs stop at WAU and spend. The number that actually predicts long-term adoption is messages-per-WAU — specifically, whether it rises over time for the same cohort. A team where WAU is flat but messages-per-WAU keeps climbing is building genuine habits. A team where WAU grows but messages-per-WAU stays at two or three is accumulating one-and-done experimenters who will churn the moment a newer tool appears.
The practical implication: don't optimize for user count. Optimize for depth of use within the users you already have. Document the prompts that drive high-frequency sessions, package them, and distribute them. That is how experiments become workflows, and workflows become measurable business value. Analytics is the map; prompt management is how you act on it.
Promptchief turns your analytics findings into reusable workflows
When your usage data surfaces a high-performing prompt, the next problem is distribution — getting that prompt into every team member's hands without a Slack thread that gets buried in two days.
Promptchief's cloud-synced prompt manager works across ChatGPT, Claude, Gemini, and 24 other platforms from a single Chrome extension or web app. Save the prompts your analytics flag as high-value, organize them into team libraries, and inject them directly into any AI interface without copy-pasting. The built-in productivity analytics complement your usage dashboard by adding prompt-level context — which prompts get reused, by whom, and how often. Explore Promptchief's plans and start turning your best-performing prompts into shared team assets today.
FAQ
What are the most important ChatGPT usage metrics to track?
WAU, total credits consumed, cost per prompt, requests per user, and requests per project cover both adoption health and cost risk in a single weekly review.
How does the OpenAI Cost API work for analytics?
The Cost API exposes credit usage data at the request level, letting admins pull spend by model, user, and project into any data warehouse or BI tool.
How do you track ChatGPT usage across multiple AI platforms?
Use a prompt management platform like Promptchief that captures prompt-level metadata across 27+ AI tools, then join that data against each platform's billing export for a unified cross-platform view.
What is a healthy messages-per-WAU benchmark?
Messages per user per week varies widely across enterprise cohorts, signaling depth of use and allowing for meaningful cross-team comparisons.
How often should you review ChatGPT usage analytics?
Weekly for KPI snapshots and credit alerts, monthly for cohort comparisons and intervention measurement, with a minimum two-to-four week window for any pre/post analysis to be reliable.